Topic 4, Misc. Questions
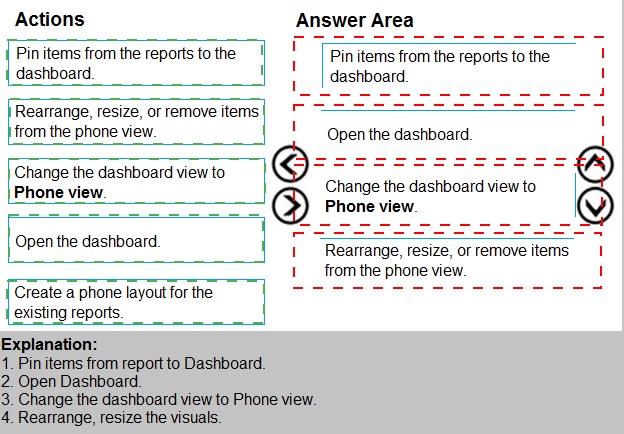
You are using existing reports to build a dashboard that will be viewed frequently in portrait
mode on mobile phones.
You need to build the dashboard.
Which four actions should you perform in sequence? To answer, move the appropriate
actions from the list of actions to the answer area and arrange them in the correct order
Note: This question is a part of a series of questions that present the same scenario. For
your convenience, the scenario is repeated in each question. Each question presents a
different goal and answer choices, but the text of the scenario is exactly the same in each
question in this series.
Start of repeated scenario
You have a Microsoft SQL Server database that has the tables shown in the Database
Diagram exhibit. (Click the Exhibit.)
You have a table that contains sales data and approximately 1,000 rows.
You need to identify outliers in the table. Which type of visualization should you use?
A.
area chart
B.
donut chart
C.
scatter plot
D.
pie chart
scatter plot
Explanation:
Outliers are those data points that lie outside the overall pattern of distribution & the easiest
way to detect outliers is though graphs. Box plots, Scatter plots can help detect them
easily.
Reference:
https://towardsdatascience.com/this-article-is-about-identifying-outliers-through-funnelplots-
using-the-microsoft-power-bi-d7ad16ac9ccc
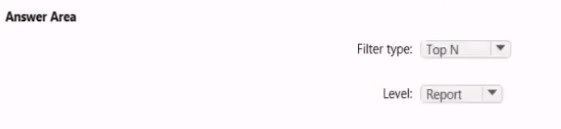
You need to create the Top Customers report.
Which type of filter should you use, and at which level should you apply the filter? To
answer, select the appropriate options in the answer area.
NOTE; Each correct selection is worth one point.
You have a sales system that contains the tables shown in the following table.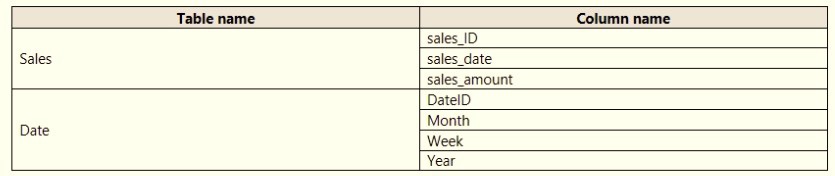
The Date table is marked as a date table.
DatelD is the date data type. You need to create an annual sales growth percentage measure. Which DAX expression should you use?
A.
SUM(sales[sales_amount]) - CALCULATE(SUM(sales[sales_amount]),
SAMEPERIODLASTYEAR('Date'[DateID])
B.
(SUM(‘Sales’[sales_amount]) - CALCULATE(SUM(‘Sales’[sales_amount]),
SAMEPERIODLASTYEAR(‘Date’[DateID])))
/ CALCULATE(SUM(‘Sales’[sales_amount]), SAMEPERIODLASTYEAR(‘Date’[DateID]))
C.
CALCULATE(SUM(sales[sales_amount]), DATESYTD(‘Date’[DateID]))
D.
CALCULATE(SUM(sales[sales_amount]), SAMEPERIODLASTYEAR(‘Date’[DateID]))
(SUM(‘Sales’[sales_amount]) - CALCULATE(SUM(‘Sales’[sales_amount]),
SAMEPERIODLASTYEAR(‘Date’[DateID])))
/ CALCULATE(SUM(‘Sales’[sales_amount]), SAMEPERIODLASTYEAR(‘Date’[DateID]))
SAMEPERIODLASTYEAR returns a table that contains a column of dates shifted one year
back in time from the dates in the specified dates column, in the current context.
Reference:
https://docs.microsoft.com/en-us/dax/sameperiodlastyear-function-dax
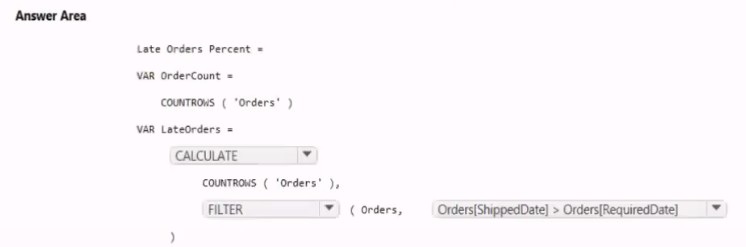
You need to create a measure that will return the percentage of late orders.
How should you complete the DAX expression? To answer, select the appropriate options in the answer area. NOTE: Each correct selection is worth one point.
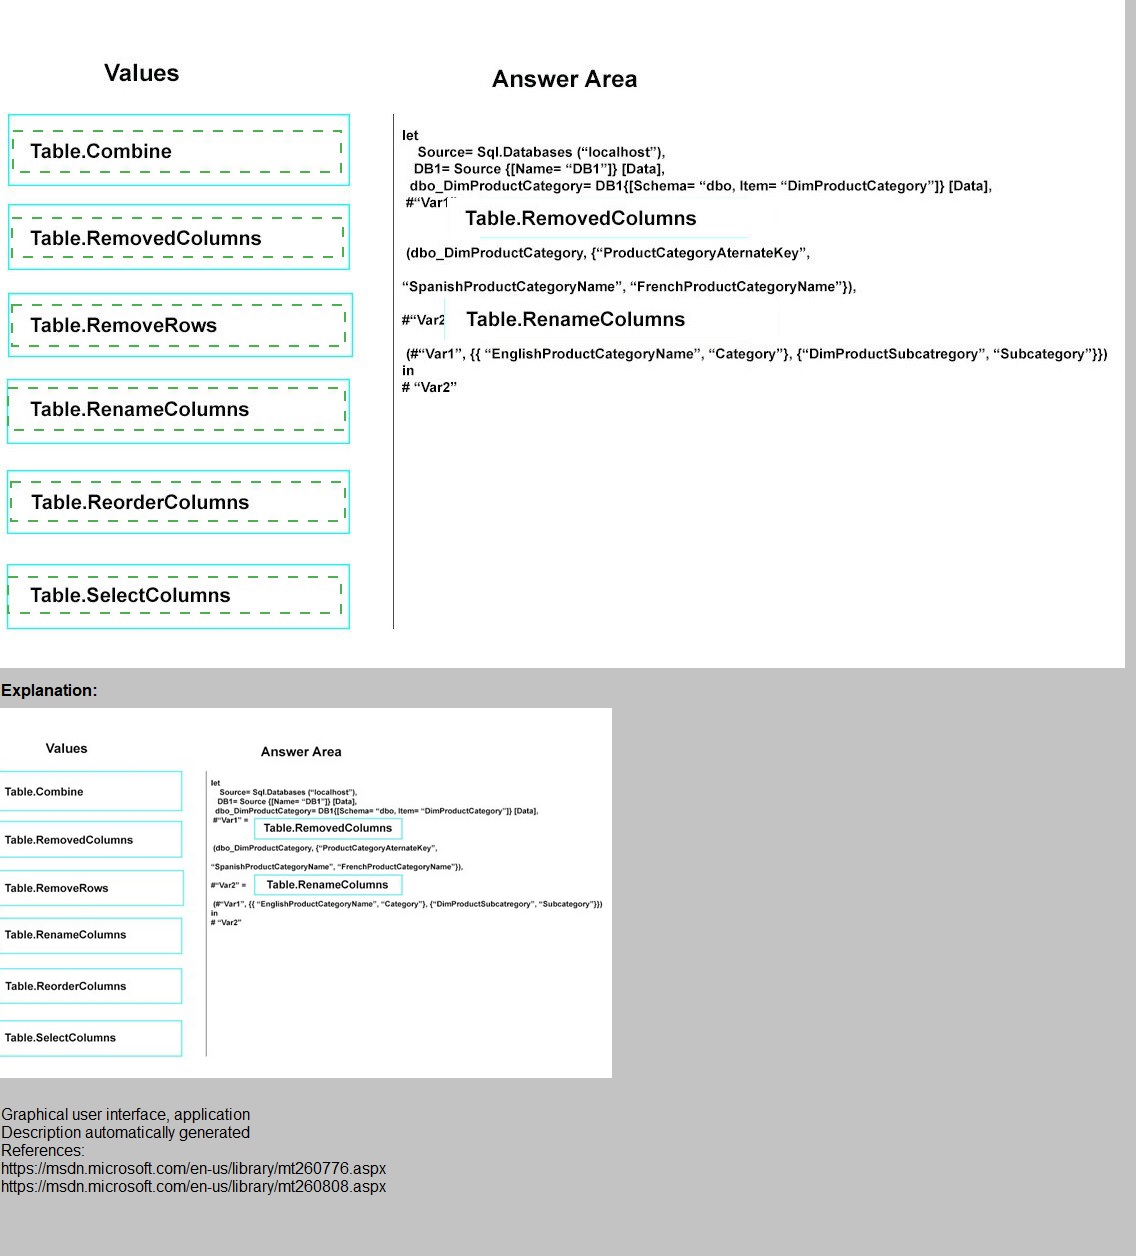
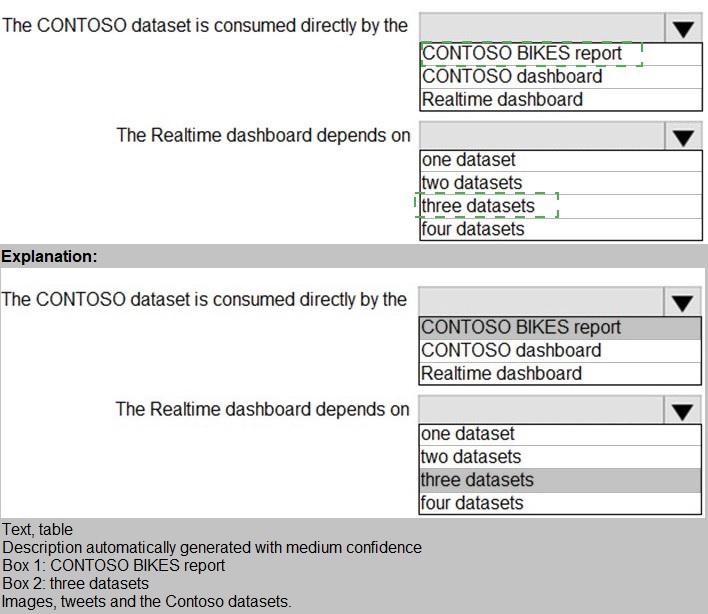
You have the data lineage shown in the following exhibit.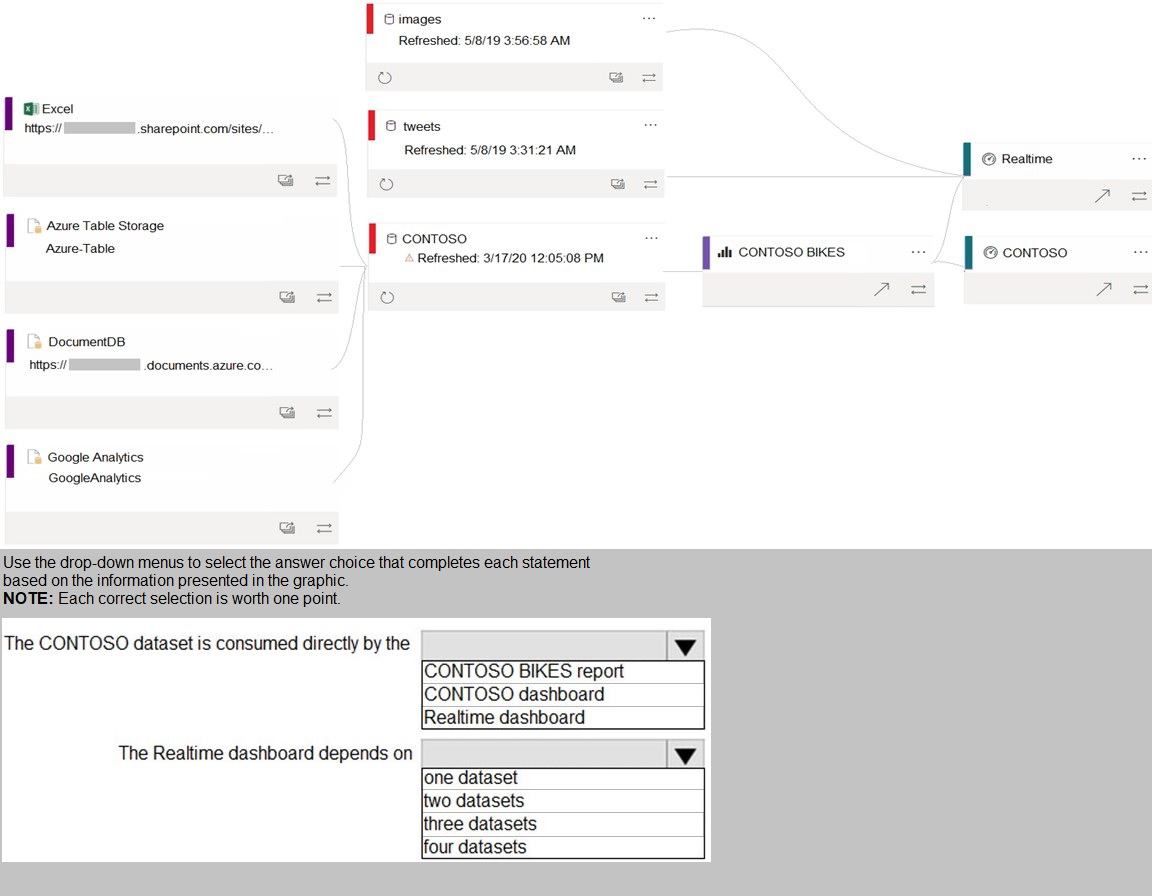
You create the following step by using Power Query Editor.
=
Table.ReplaceValue(SalesLT_Address,"1318","1319",Replacer.ReplaceText,{"AddressLine
1"})
A row has a value of 21318 Lasalle Street in the AddressLine1 column. What will the value
be when the step is applied?
A.
1318
B.
1319
C.
21318 Lasalle Street
D.
21319 Lasalle Street
21319 Lasalle Street
Explanation:
Example:
Replace the text "ur" with the text "or" in the table
ion have a Power BI dataset that contains a table named Temperature Readings.
Temperature Readings contains the columns shown in the following table.
The table has 12 million rows. All the columns are needed for analysis.
You need to optimize the dataset to decrease the model size. The solution must not affect
the precision of the data.
What should you do?
A.
Split the DateTime column into separate date and time columns.
B.
Disable the Power Query load.
C.
Round the Longitude column two decimal places.
D.
Change the data type of the TempCelsius column to Integer
Disable the Power Query load.
Explanation:
Disable Power Query load.
Power Query queries that are intended support data integration with other queries should
not be loaded to the model. To avoid loading the query to the model, take care to ensure
that you disable query load in these instances.
Reference:
https://docs.microsoft.com/en-us/power-bi/guidance/import-modeling-datareduction#
disable-power-query-query-load
Note: This question is part of a series of questions that present the same scenarioEach question in the series contains a unique solution that might meet the stated
goals. Some question sets might have more than one correct solution, while others
might not have a correct solution.
After you answer a question in this scenario, you will NOT be able to return to it. As
a result, these questions will not appear in the review screen.
You have several reports and dashboards in a workspace.
You need to grant all organizational users read access to a dashboard and several reports.
Solution: You publish an app to the entire organization.
Does this meet the goal?
A.
Yes
B.
No
Yes
Explanation: https://docs.microsoft.com/es-es/power-bi/collaborate-share/service-createdistribute-
apps
| Page 9 out of 29 Pages |
| Previous |
Copyright © - All Rights Reserved