When conducting a Hypothesis Test using Continuous Data the proper sample size is
influenced only by the extent to which we need to assess a Difference to be detected but
not the inherent variation in the process.
A.
True
B.
False
False
To establish a sample size that will allow the proper overlap of distributions we do which of
these?
A.
Multiply Alpha by 1.75
B.
Calculate one minus Beta
C.
Calculate Beta plus 2
D.
Multiply Beta by 3
Calculate one minus Beta
Questions that can be best answered by a Visual Factory include all of these except
_____________________.
A.
Are setups optimized for lower scrap levels?
B.
Can extra inventory be seen easily?
C.
Can changeover challenges be recognized?
D.
Are unneeded tools or supplies easily noted?
Are setups optimized for lower scrap levels?
The method of Steepest Ascent guides you toward a target inside the original inference
space.
A.
True
B.
False
False
When doing Hypothesis Testing on Non-normal data Belts will use a ________________ to
compare more than two sample proportions to each other.
A.
Z score Table
B.
Sakami Table
C.
Mean-to-Mode Analysis
D.
Contingency Table
Mean-to-Mode Analysis
Appropriate measures means that measurements are ______________.
A.
Representative
B.
Sufficient
C.
Contextual
D.
Relevant
E.
All of these answers are correct
All of these answers are correct
Which of these are examples of business metrics or Key Performance Indicators commonly
referred to as KPI’s?
A.
Cycle Time
B.
Defects
C.
No. of Units Reworked
D.
Labor Hours
E.
All of these answers are correct
All of these answers are correct
The class score distribution of schools in a metropolitan area is shown here along with an
analysis output. Comment on the statistical significance between the Means of the two
distributions. Select the most appropriate statement.
A.
The two class Means are statistically different from each other
B.
The two class Means statistically not different from each other
C.
Inadequate information on class Means to make any statistical conclusions
D.
A visual comparison shows that class Means are not statistically different
The two class Means are statistically different from each other
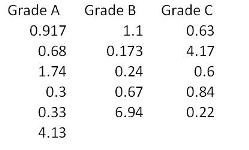
For the data shown here which statement(s) are true?(Note:There are 2 correct answers).
A.
With 95% confidence, we cannot conclude if the samples are from three Normal
Distributions.
B.
With greater than 95% confidence, we conclude the samples are from Non-normal
Distributions.
C.
If we wanted to compare the Central Tendencies of these three samples we would use
the one way ANOVA test.
D.
If we wanted to compare the Central Tendencies of these three samples we could use
Mood’s Median test.
With greater than 95% confidence, we conclude the samples are from Non-normal
Distributions.
If we wanted to compare the Central Tendencies of these three samples we could use
Mood’s Median test.
What is the Ppk of a process with a spread of 24 units, an average of 68, an upper limit of
82 and a lower limit of 54?
A.
1.68
B.
2.00
C.
4.00
D.
4.42
4.00
| Page 4 out of 25 Pages |
| Previous |