When a Belt properly analyzes the results of an experiment he must examine the Residuals
in expectation of finding all of the following except _________.
A.
Some Residuals higher than others
B.
Some Residuals lower than others
C.
All Residuals within 2 Standard Deviations of the Mean
D.
Residuals will represent a Linear Regression
Residuals will represent a Linear Regression
Contingency Tables are used to test for association, or dependency, between two or more
classifications.
A.
True
B.
False
True
A valid mathematical Regression represents all of the characteristics shown except
_________________.
A.
All of the standardized residuals will be within ±3 Standard Deviations
B.
The sum of the residuals is zero
C.
The residuals when plotted follow a Normal Distribution
D.
Most standardized residuals are within ±2 Standard Deviations
E.
The Residual is equal to the difference between the observed and predicted values
All of the standardized residuals will be within ±3 Standard Deviations
Which one of the listed tools is frequently used to help drill down to possible causes once a
Fishbone Diagram is constructed?
A.
3 When Analysis
B.
Skeleton Diagnostic
C.
Ishikawa Diagram
D.
5 Why Analysis
5 Why Analysis
The English words used for the 5S’s are __________ , _____________ , Shining,
Standardizing and Sustaining.(Note:There are 2 correct answers).
A.
Shaping
B.
Sorting
C.
Shifting
D.
Straightening
Sorting
Straightening
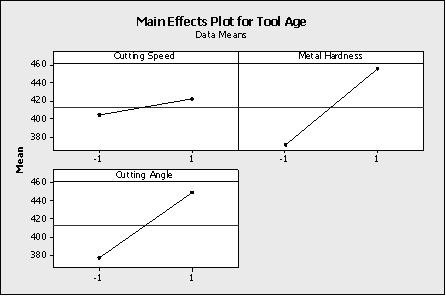
Which statement(s) are correct about the DOE Factorial plot output here?(Note:There are 3
correct answers).
A.
Two factors were operated at 3 levels each
B.
The highest tool age was achieved with metal hardness at high level while keeping the
cutting speed at the low level
C.
The design indicated above is a 32 factorial design
D.
The cutting speed and cutting angle are at the low level for the least tool age achieved
E.
All factors had 2 levels in the experiment
The highest tool age was achieved with metal hardness at high level while keeping the
cutting speed at the low level
The design indicated above is a 32 factorial design
All factors had 2 levels in the experiment
The distance between the Mean of a data set and the Point of Inflection on a Normal curve
is called the _______________.
A.
Curve Spread
B.
Standard Deviation
C.
Numerical Average
D.
Data Breadth
Standard Deviation
To be an effective Lean Six Sigma practitioner one must understand the difference
between ___________________________.
A.
ANOVA and the Analysis of Variance
B.
Nonparametric tests and tests of Non-normal Data
C.
F-test and test of variances of 2 samples
D.
Practical and Statistical significance
Practical and Statistical significance
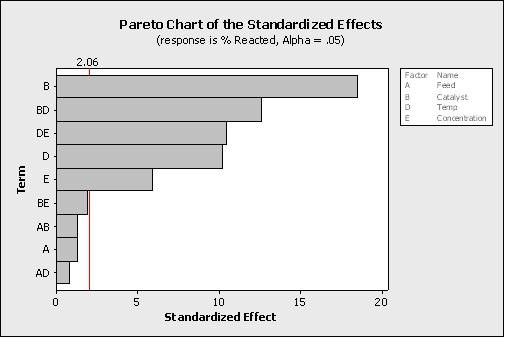
Which statement(s) are correct about the Pareto Chart shown here for the DOE analysis?(Note:There are 2 correct answers)
A.
It is unknown from this graph how many factors were in the Experimental Design
B.
The factors to keep in the mathematical model are E, D, DE, BD and B with an alpha
risk equal to 2.06
C.
The effects to keep in the mathematical model are E, D, DE, BD and B with an alpha
risk equal to 0.05
D.
The factors to keep in the mathematical model with a 5% alpha risk are BE, AB, A and
AD
It is unknown from this graph how many factors were in the Experimental Design
The effects to keep in the mathematical model are E, D, DE, BD and B with an alpha
risk equal to 0.05
Of the various types of data shown below which is NOT representative of Variable Data.
A.
Length of a table
B.
Liters of solution added to a formula
C.
Number of employees wearing a uniform
D.
Miles per hour of a vehicle
Number of employees wearing a uniform
| Page 3 out of 25 Pages |
| Previous |